Have you ever been the researcher presenting results to a group – let’s say clinicians – only to have your hard work and presentation fall flat? You are excited, well-prepared and keen to show others what you are finding. “These results can help change policy and practice,” you say. They nod politely but you suspect they just don’t get it. In other words, despite your best efforts, the stakeholders are not all that interested in your results.
Keeping stakeholders engaged throughout the research process is not an easy job. So why bother?
If you are like most health services researchers at some point you have probably said, “The last thing I want is to have these results sitting on a shelf collecting dust. I want this work to make a difference!” Qualitative researchers like me want to honor the voices of the participants and make effective use of the information shared with us. We want the time and effort that good research takes to pay off – for all stakeholders.
Truth be told, I know some of my own health services research has merely been a dust collector. Even when all agreed the work was sound and the results were valid – policy or practice didn’t change because of it. Then again, other pieces of research I have worked on have been used in ways that were very satisfying.
What was different?
There are many factors that contribute to research results being used but I find one of the most important things is ensuring stakeholders are engaged from start to finish. This can include stakeholder input on the research questions (is it relevant?), the methods (do they have interview contacts?), framing the analysis perspectives (do your conclusions fit the context?); and of course – how best to use the results (who should hear about this work? how to present it to them? are there any upcoming opportunities to talk about it?).
Even if they start with dedication and enthusiasm, stakeholders may vary widely in their background, experience and knowledge of research – from health care providers with a clinical focus, to senior operations leaders who think in terms of numbers, to patients who are interested in individual outcomes. Often stakeholders have little time to read the interim reports or think about the research between meetings. Lack of familiarity with qualitative research may also leave them wondering “so what?” when you present the results.
Contrast that attitude with the dedicated researcher, immersed in the iterative qualitative analysis process and the coding, memos, queries and team discussion to produce solid themes that represent the data. We as researchers are so taken by the quotes, so passionate about the words, so pleased with the emerging themes that we think the value is obvious to everyone. But it may not be obvious at all.
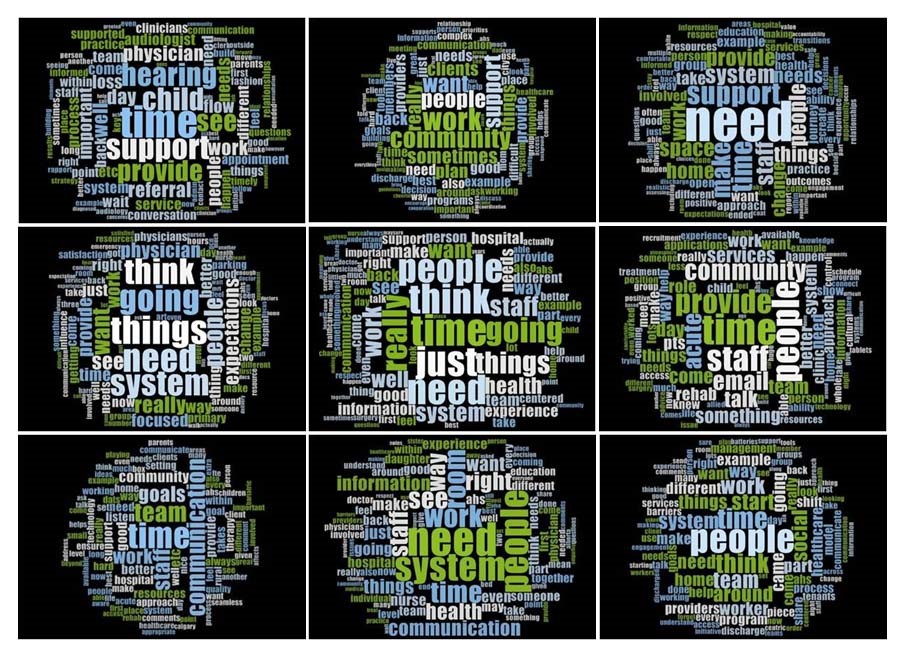
Helping stakeholders make the link between data and the relevance to the research is essential to answering the “so what” question. I have found some visual tools help me get stakeholders thinking about the data. Let me share an example using NVivo’s word clouds that illustrate frequency of word use by the size of the font.
In an environmental scan that included hundreds of people interviewed in dozens of focus groups, we assessed the current state of provision of patient and family centered care in an organization. In one word cloud we produced for the report, ‘time’ showed up front and center.
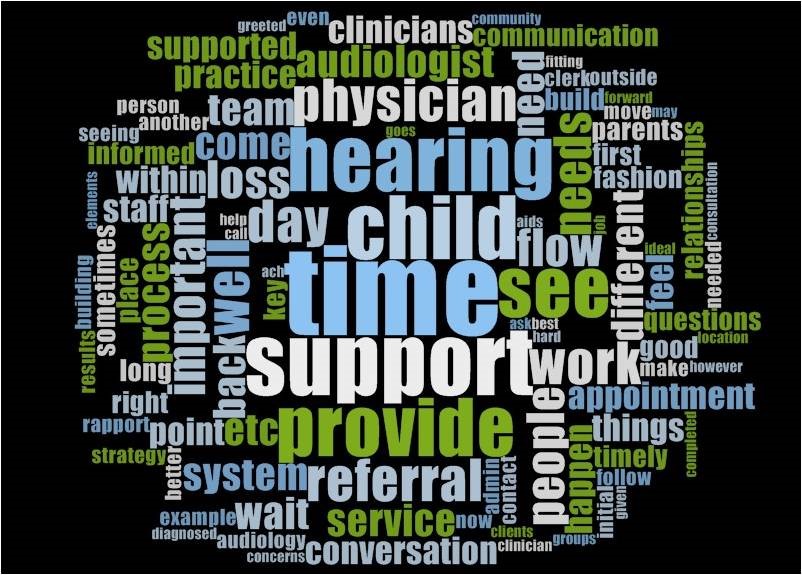
One steering committee member commented, “Well that makes sense. All this data is from health care providers. They’re probably saying they don’t have ‘time’ to provide patient and family centered care. Wait until you show the patient data. I’ll bet ‘time’ doesn’t show up as frequently.”
But ‘time’ did show up frequently in the patient data – and in almost every focus group.
But, we explained, the interviewees were using ‘time’ differently. Health care providers talked about needing ‘time’ to provide care. Patients talked about wait ‘time’ and wanting more ‘time’ with health care providers. And our theme about ‘time’ reflected that.
Suddenly the steering committee was engaged in the data – examining all the word clouds, assessing the themes against the word frequency, asking about words they expected to see but were missing, and so on. The word clouds were so effective that we used them on the cover pages of reports returned to focus group participants and as illustrations throughout the final report. Every time we shared them we received positive comments.
In short, NVivo’s word clouds helped us engage the stakeholders in understanding the data and thinking about the themes. That work successfully formed the basis of a new organizational strategy about patient centered care. Mission accomplished!
So what?
Next time you are presenting qualitative data and want to engage your stakeholders, consider using a visual tool like a word cloud. See if you can get them talking about the data. It just might help you ensure your work does make a difference.
The opinions expressed in this blog post are the author's own and do not necessarily reflect the view of AcademyHealth.Organizational Affiliates are a critical link in AcademyHealth’s ability to effectively advocate for the field, and support the future field of health services researchers. Organizational Affiliates gain visibility among AcademyHealth membership, enjoy unique networking opportunities, and benefit from event discounts. Click here to learn more.